
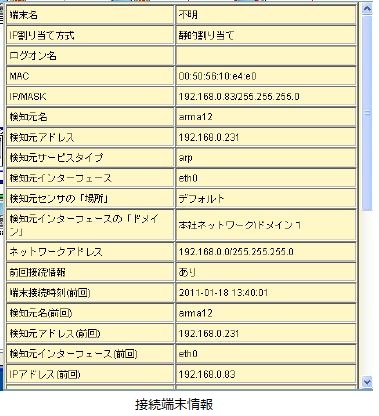
NetSkateKoban Manager saves connection information sent from NetSkateKoban sensors or connection information sent from other services as "connected terminal history." From this history of connected terminals, you can search for the connection status of user terminals that are currently or have existed on the network in the past, and display them as a network map. From a terminal on the network map, you can search for the system information of the terminal, which port on the switch it is connected to, and also check the terminal usage history to see if it was connected in the past, allowing the administrator to determine that it is an unauthorized terminal. If this happens, you can interfere with communication or block ports. Additionally, the administrator can determine that the device is normal and exclude it from being monitored by the NetSkateKoban system by adding the MAC address to the filter, or can assign the device to a registered user as the device owner.
Location Settings
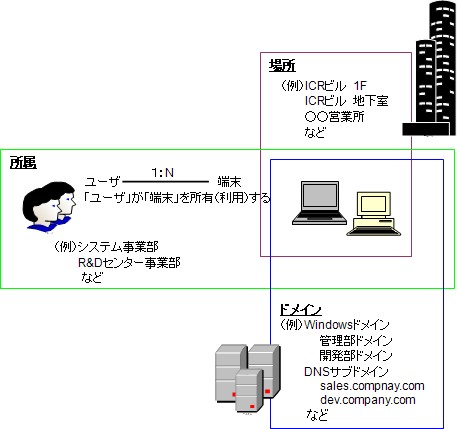
Set your location to display a map of the network being monitored by NetSkateKoban. A location consists of "location," "domain," and "affiliation," and each can have a hierarchical structure.
Place
Information that represents the geographical and physical location of a target. To use it, enter the location, building name, floor name, room name, information outlet number, server rack number, etc.
Domain
Information that represents the network location of the target. Enter the Windows domain name, DNS domain name, VLAN name, etc.
Affiliation
This information represents the company or department to which the target belongs. Enter the company name, department name, etc. Example) When you specify the affiliation for a terminal in NetSkateKoban, it is used to mean the affiliation for asset management of that terminal.
Generating a Network Map
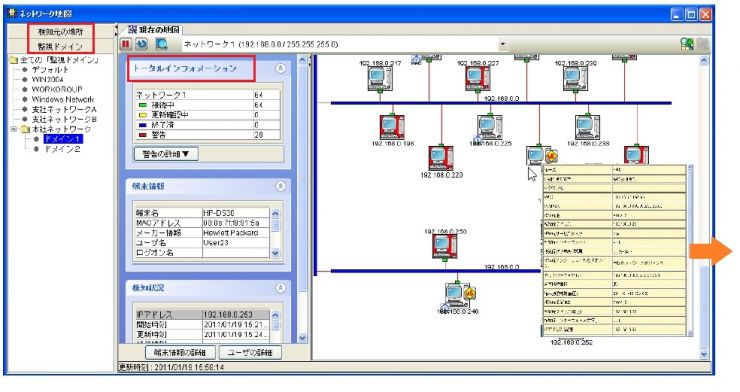
Network Map (Details)
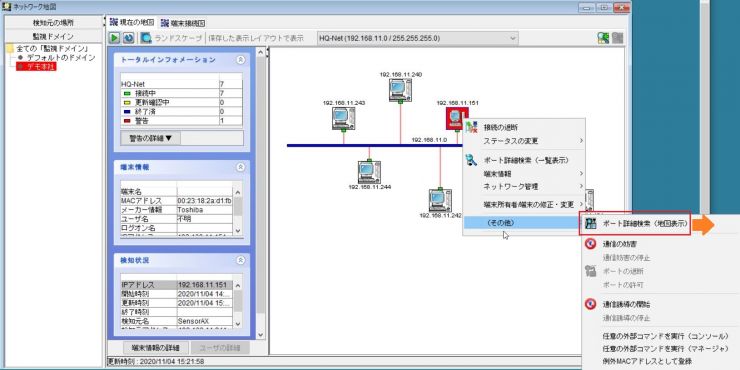
For networks set as monitoring targets, you can display the network map (details) by selecting a location or domain from Location and selecting the network from the combo box on the toolbar. The network map (details) shows terminals connected to the network, and you can check information about the connected terminal (terminal name, IP address, MAC address, etc.) by simply positioning the cursor on the terminal.
Location
Detection source location: Indicates the installation location of the detection source sensor, and displays a map of devices detected by the sensor at that location.
Monitoring domain: Represents the domain of the sensor's monitoring interface, and displays a map of devices detected by that interface.
Total Information
Displays the number of terminals for each of the following terminal states.
Connected: Displays the number of connected devices.
Checking for updates: Displays the number of devices that are connected but have not been confirmed.
Terminated: Displays the number of terminals that have terminated the connection.
Warning: Displays the number of detected warnings such as unregistered terminals.
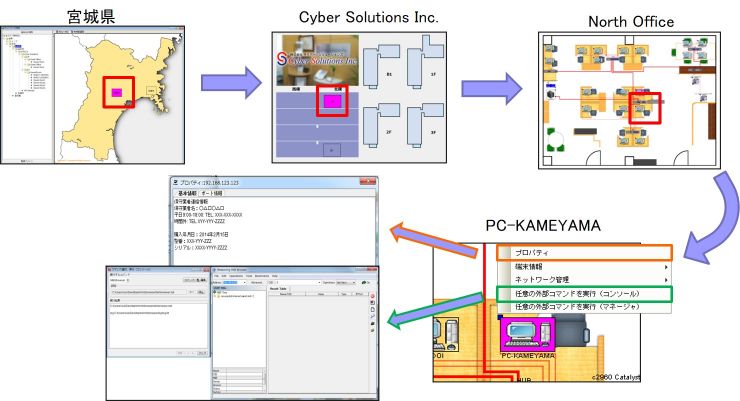
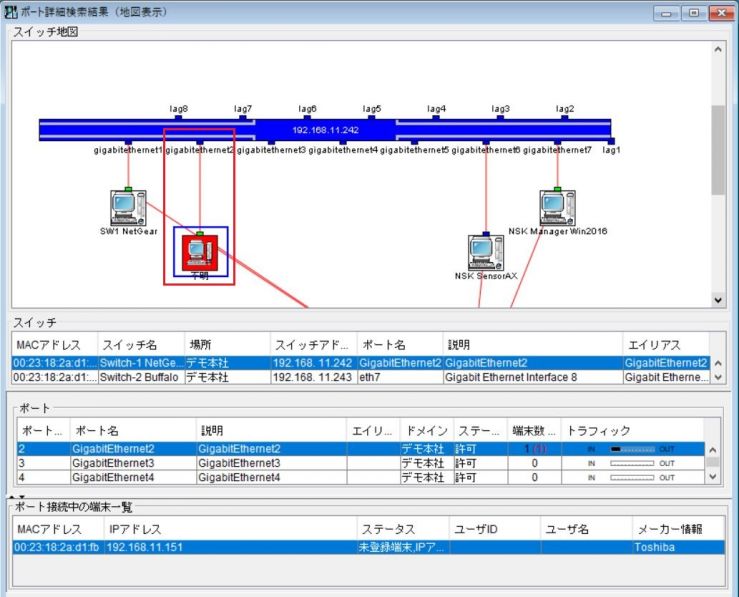
Device Connection Port Search
You can search to which port of the Ethernet switch the terminal displayed on the network map is connected. This makes it possible to quickly identify the installation location of illegally connected terminals or abnormal terminals, and to quickly take necessary measures.
Display of IoT Devices also
Since it detects all devices connected to the network that communicate via TCP/IP, it also detects all IoT devices other than IT devices such as PCs and displays them on the network map.
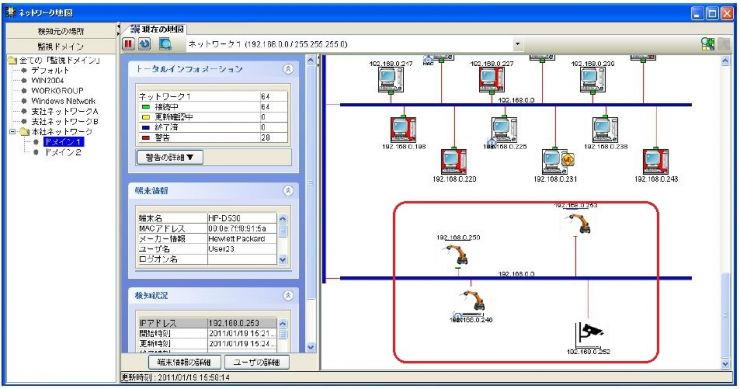
Note) In the above figure, the icon is edited using the editing function. By default, it is displayed on PC.
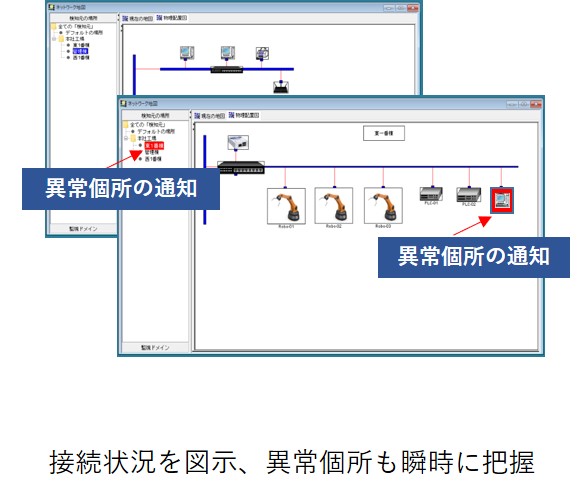
Creating a Physical Layout Diagram
You can edit the displayed network map to create a more visible network map (physical layout map).